
Long C++ build times are rarely caused by compiler flags.
They’re caused by project structure, headers, and how tools are used.
In this article, I show how to analyze real C++ compilation bottlenecks using practical tools — not guesswork.
You’ll learn:
- how to identify the most expensive headers and translation units
- when to use
ClangBuildAnalyzervs compiler JSON reports - how to reason about compile time instead of blindly tweaking flags
- what actually moves the needle in large C++ projects
This is not about micro-optimizations.
It’s about understanding how your C++ build really works.
👉 If you want more practical C++ and CMake engineering like this, I share it regularly in my newsletter.
Instruments
There are not many tools to detect compilation bottlenecks in a project. One of the most efficient is the Clang compiler, which supports the -ftime-trace flag. This flag instructs the compiler to generate a report for each compilation unit. The report, in JSON format, contains various compilation events related to a specific translation unit, such as including a header file or instantiating a template.
Investigating a single file
If you want to examine a specific report for a single translation unit, the best way is to use Chrome’s tracing utility, available at chrome://tracing/. In your build folder, you should find a report file with almost the same name as the corresponding .cpp file, but with the .json extension. For example, in my project I have a translation unit threadpool.cpp, so in the build directory I find the report threadpool.cpp.json.
When you open this report in the Chrome tracing utility, you’ll see a chart containing details such as how much time the compiler frontend and backend consumed, how long it took to include all header files (shown under the bar “Total Source”), and other useful data.

By clicking on each element in the flame graph, you can get more detailed information. For example, clicking on the “Source” element will show which header file was processed and how much time the compiler spent on it.
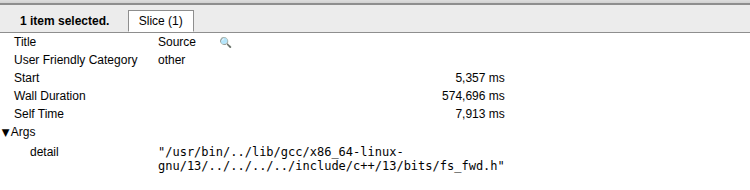
In this way most expensive headers might be detected.
Aggregating analyses
If you have a compilation time problem, then probably the project has much more then few translation When working with many translation units, manually analyzing all reports to find bottlenecks can be impractical. Instead, you can use ClangBuildAnalyzer, available at https://github.com/aras-p/ClangBuildAnalyzer. This tool provides insights on the most expensive:
- Headers to include
- Translation units and functions to compile/optimize
- Templates to instantiate
ClangBuildAnalyzer works in a two-step process:
- Create an aggregation report covering all translation units.
- Run the analysis on the aggregated data.
To generate the aggregation report, you should run:
ClangBuildAnalyzer-linux --all <artifactsdir> <filename>Here, artifactsdir is the build folder of your project where the JSON reports are generated, and filename is the name of the file generated by ClangBuildAnalyzer.
Then, to run the analysis, use the following additional arguments:
ClangBuildAnalyzer-linux --analyze <filename>The filename is the same as in the first step.
From the printed results, you can identify the most expensive headers and see whether they were included directly or transitively via other headers:
**** Expensive headers:
3708 ms: /usr/include/gtest/gtest.h (included 4 times, avg 927 ms), included via:
  2x: <direct include>
  1x: matchcollectormock.h gmock.h gmock-actions.h gmock-internal-utils.h
  1x: directorywalkermock.h gmock.h gmock-actions.h gmock-internal-utils.h
In addition, for example, it’s possible to get an info about the longest to instantiate templates:
**** Templates that took longest to instantiate:
  1179 ms: std::basic_regex<char>::basic_regex (2 times, avg 589 ms)
  1178 ms: std::basic_regex<char>::_M_compile (2 times, avg 589 ms)
  1134 ms: std::__detail::_Compiler<std::regex_traits<char>>::_Compiler (2 times, avg 567 ms)
   979 ms: std::__detail::_Compiler<std::regex_traits<char>>::_M_disjunction (2 times, avg 489 ms)
   972 ms: std::__detail::_Compiler<std::regex_traits<char>>::_M_alternative (2 times, avg 486 ms)
And much more other useful info.
What to use and when
I personally use ClangBuildAnalyzer to get a high-level picture of where compilation time is really spent — for example, which headers are the most expensive.
That’s crucial, because it allows you to prioritize fixes instead of guessing.
I always keep the “before” report and compare it with the results after optimization.
Without that comparison, it’s very easy to optimize the wrong thing.
In rare cases, I inspect a single translation unit using Chrome’s trace viewer and a flame graph — but only when I need to understand a very specific bottleneck.
Compile-time optimization isn’t about tweaking flags.
It’s about understanding how your project is structured and how the tooling interacts with that structure.
That mindset — understanding systems instead of blindly tuning knobs —
is exactly what I focus on in my book and my newsletter.
If you want more deep, practical explanations about C++, CMake, and real-world engineering trade-offs,
you can subscribe to my newsletter here